Rideau Canal skating season feeling the heat
The Rideau Canal is a UNESCO world heritage site and when it transforms into a skating rink during the winter, people flock from all over to skate on the 7.8 km path. Whether people use it to get to work, for exercise, or just recreation, the canal has proven to be a popular pick for locals and tourists alike.
But the 2017 season has gotten off to a disappointing start as warm temperatures have closed the canal for all but six days as of January 31.
The Rideau Canal typically closes in March, leaving little time for Ottawa residents and tourists to lace up their skates. But what do statistics reveal? We will look at some data from the National Capital Commission and Environment Canada to prove whether or not there is a trend, and how it may affect skaters.
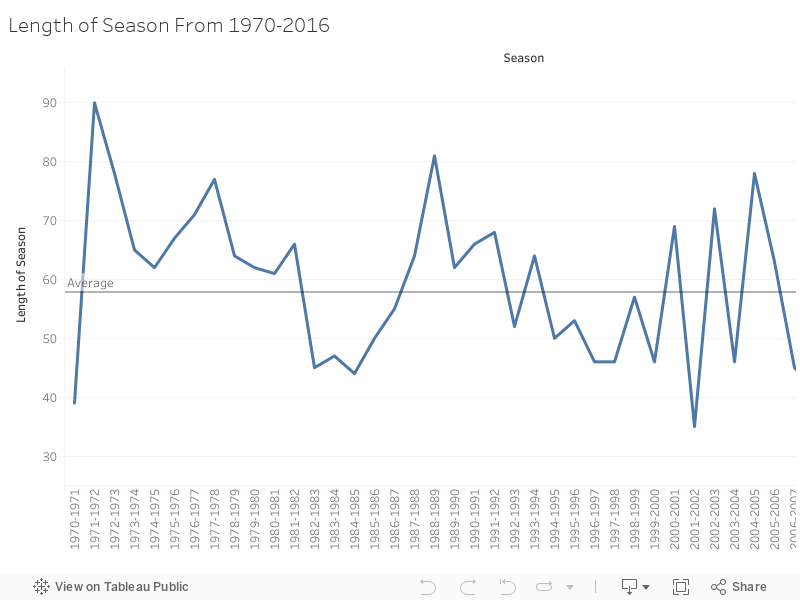
This graph reveals the length of a season, from the opening of the Rideau Canal to the close, beginning in 1970. It’s clear that the length of a season has dipped and risen from year to year. But the average length of a season has changed substantially from the beginning.
Between 1970 and 1990, the average length of a season was 62 days. In the latest two decades, 1996 to 2016, it decreased to 52 days. In the past ten years, the average has dropped to just 49 days.
Does a longer season mean more skaters?
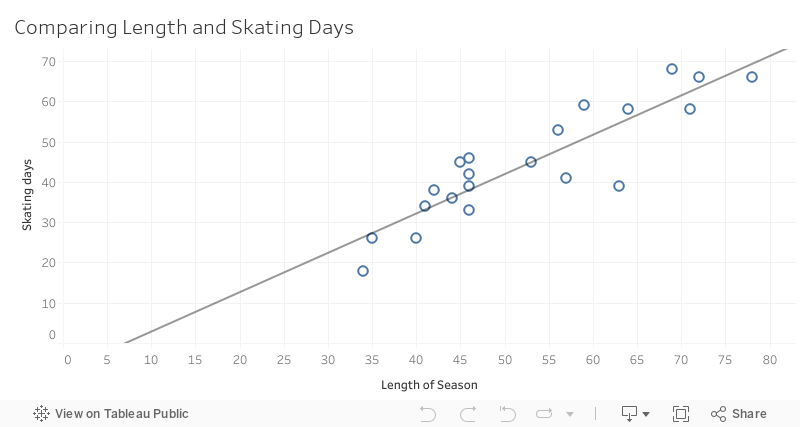
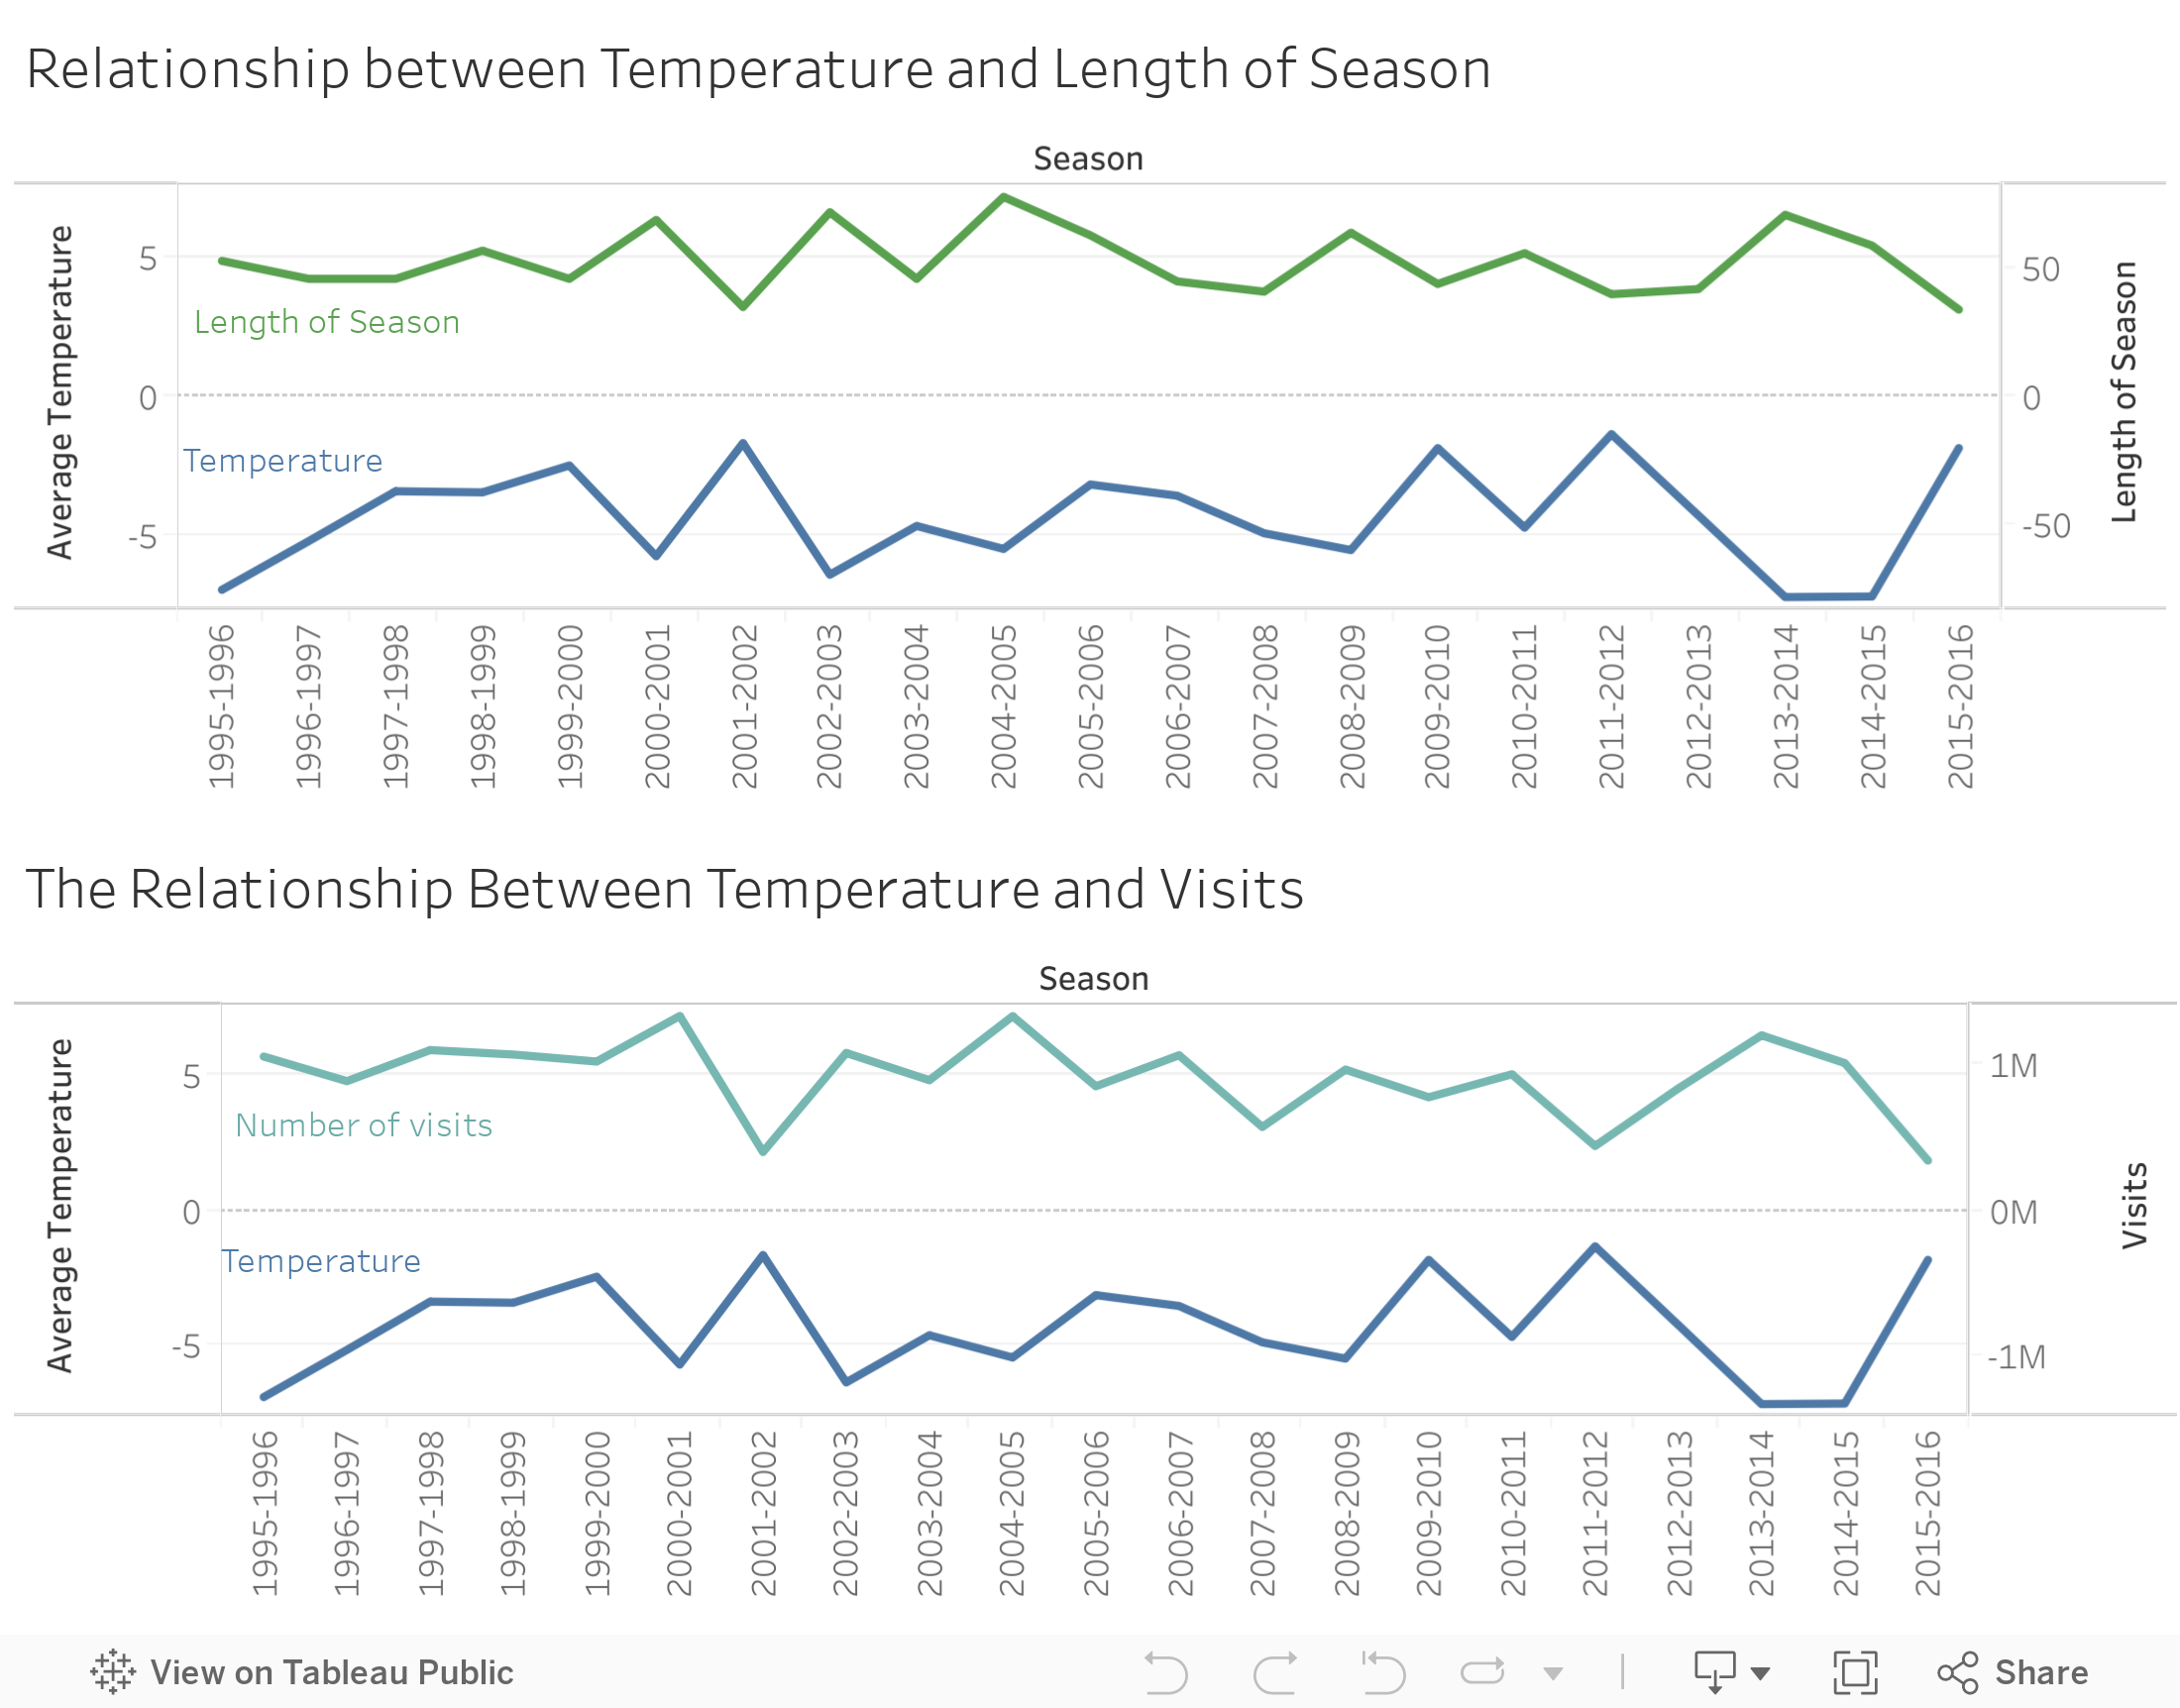
The graph above shows the correlation between the length of a season and the number of skating days. Generally, it looks like the longer the season, the more chances there are to get on the ice, which would make sense.
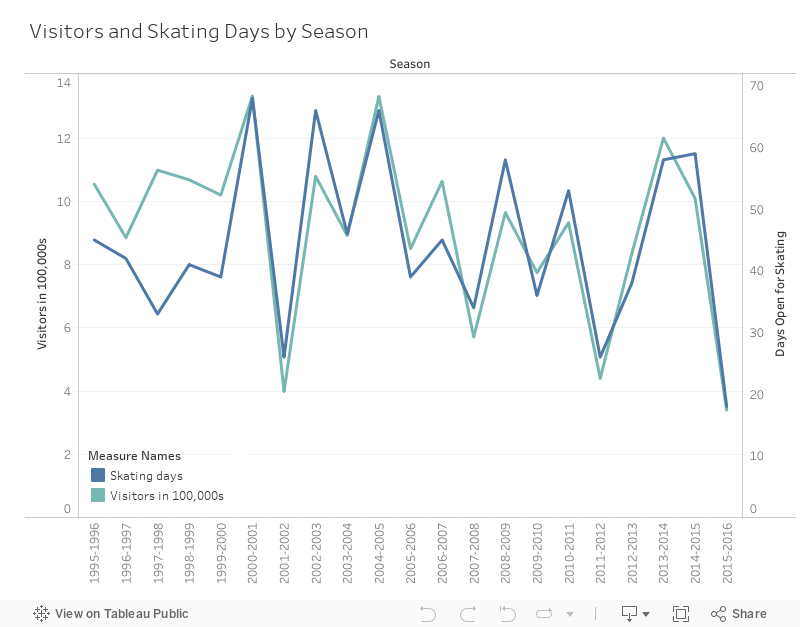
The graph below further shows that visitors and skating days are similar, using data from 1995 until last year.
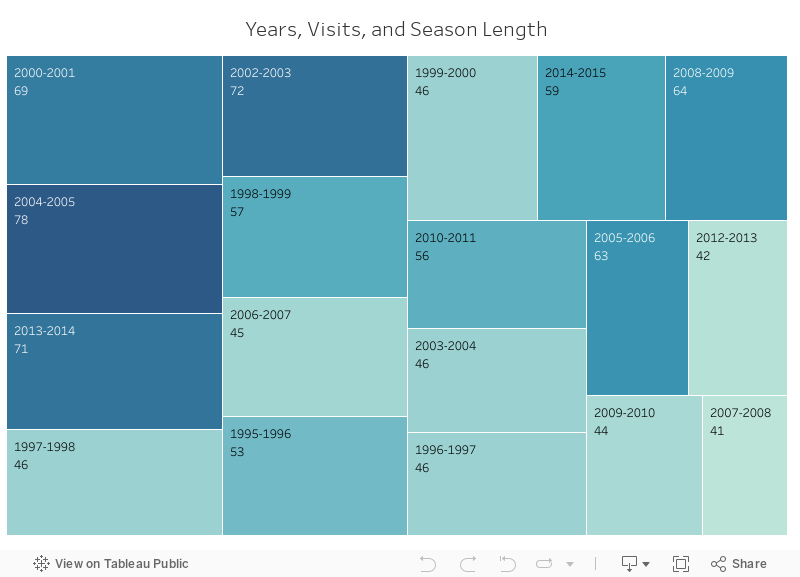
This graph reveals that it may not be as simple as a decrease in visitors and length of a season. As you can see below, some of the longest seasons with the most visitors have been in this century.
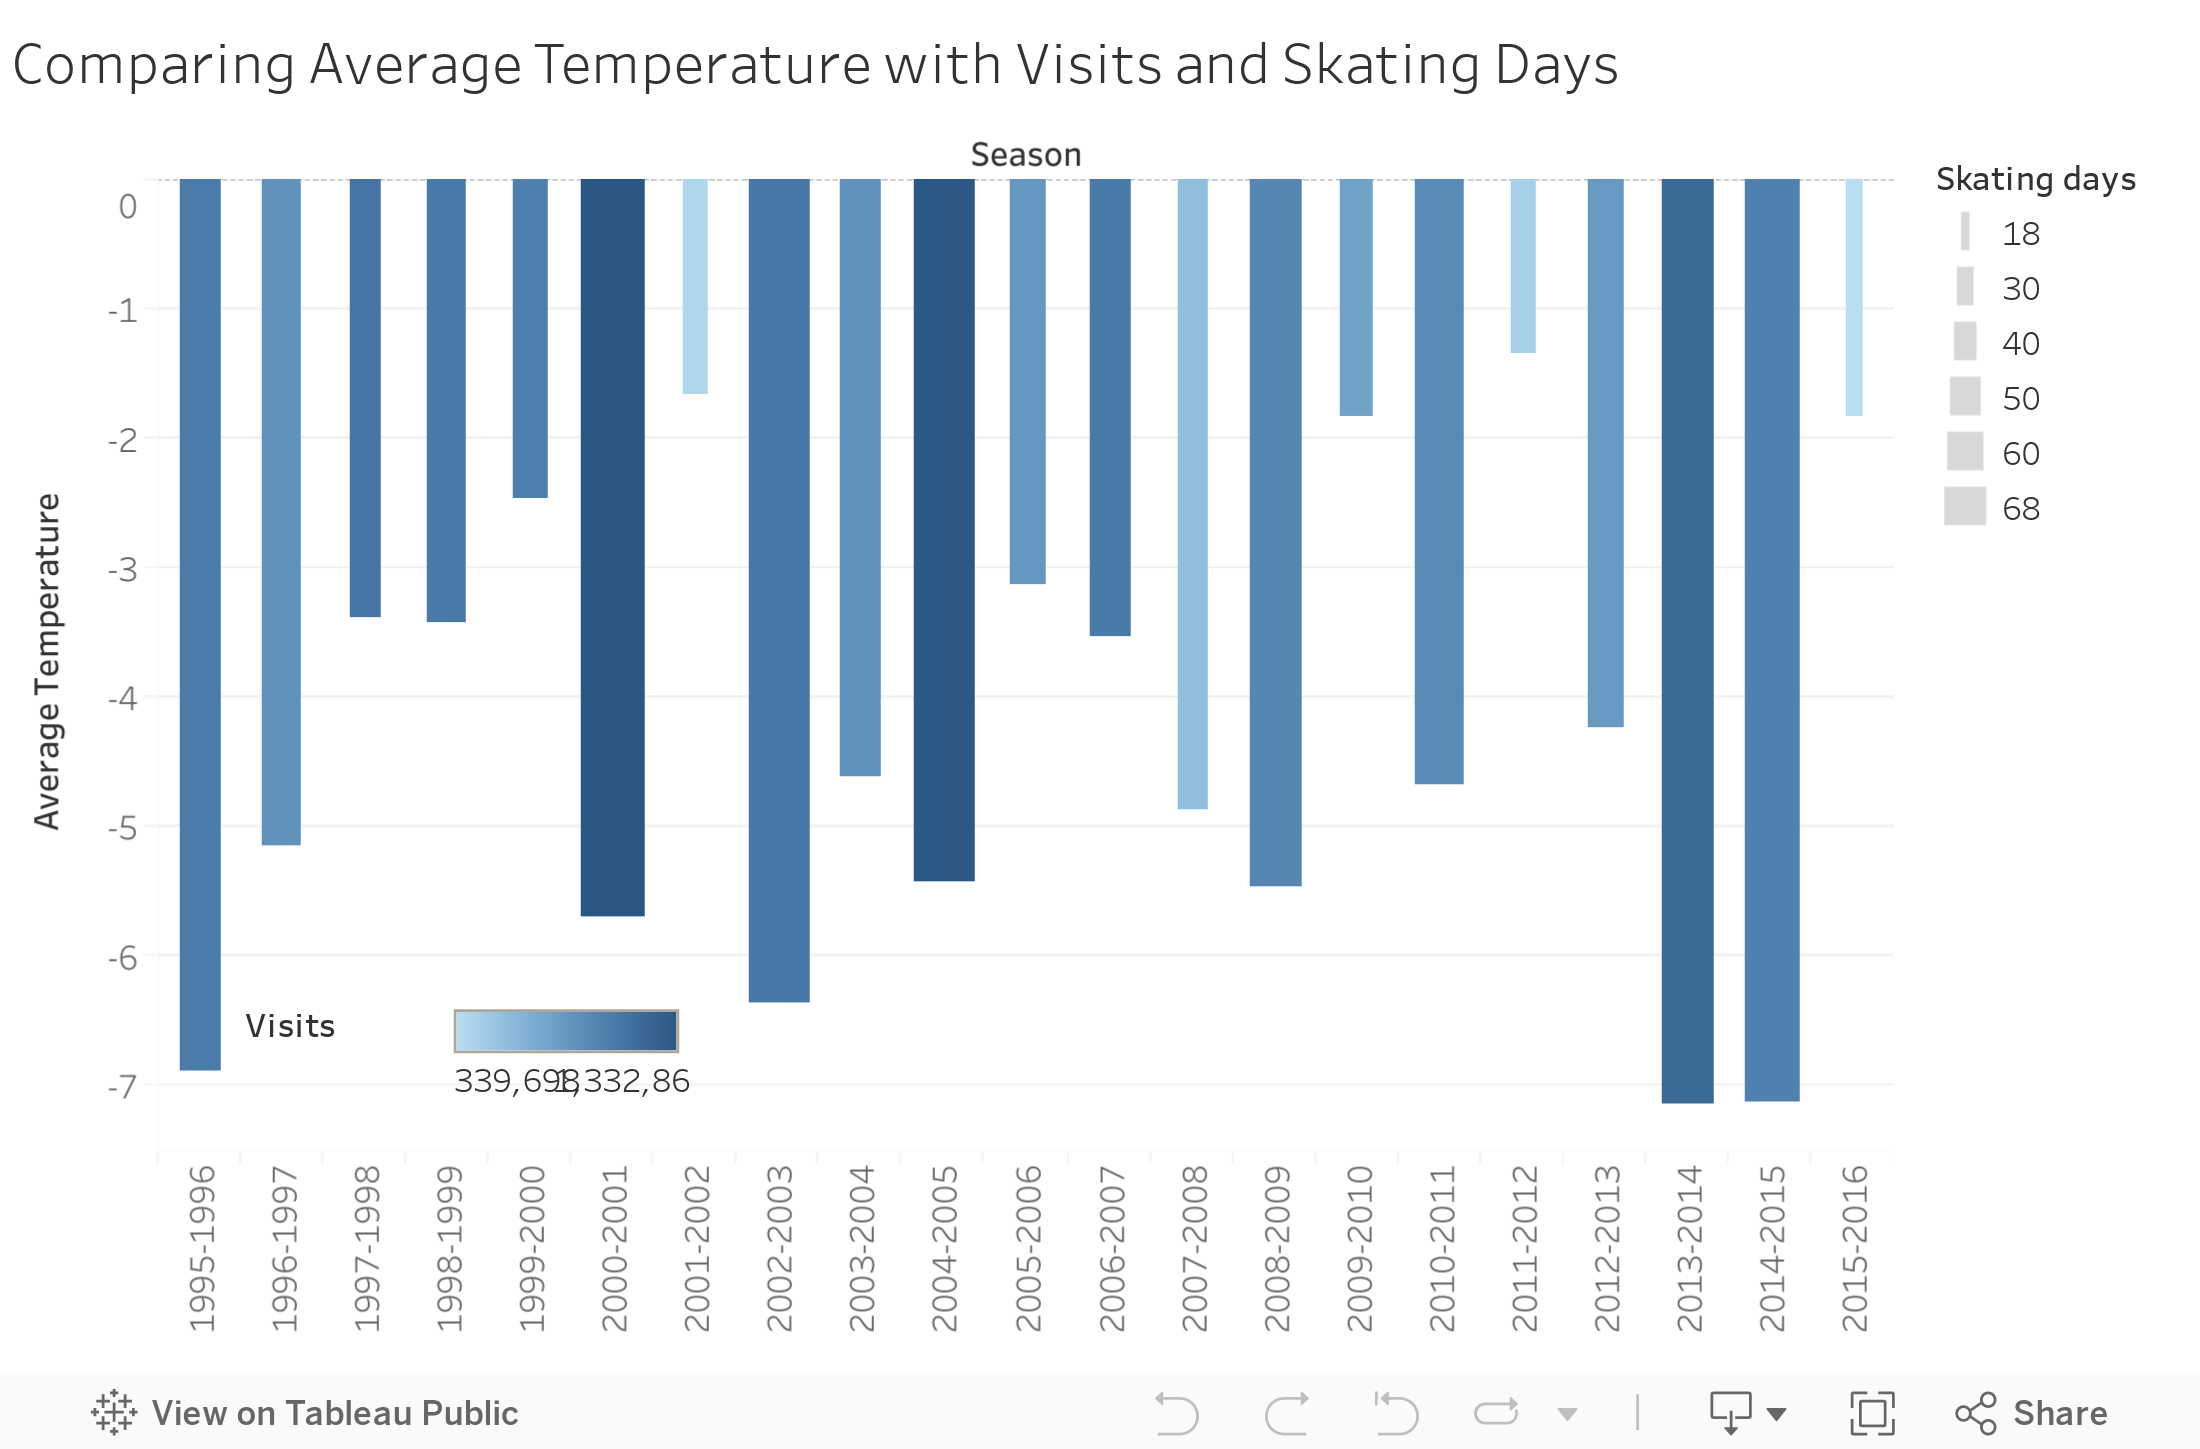
The fifth graph compares the average temperature between November and March of that season, when the Rideau Canal is typically in operation, with visits and skating days. It is clear that the cold weather didn’t frighten away the skaters. In fact, it gave visitors more chances to tear up the ice.
The sixth graph shows the length of the season in comparison to skating days. It shows that the longer the season, the more days skaters could hit the ice.
How does temperature affect the Rideau Canal?
The final graph compares average temperature with visits and skating days. As noted above, colder weather did not keep visitors away; it did the opposite. The longest bars represent the chilliest season, while the thickness represented days when the Rideau Canal was open for skaters. The darker the bar, the more visitors. If you look at the longest bars, it’s clear that they are generally thicker and darker, meaning the colder weather allowed for more skating opportunities and more visits.

Unpacking food bank use in Canada
By Nathan Bragg and Anna Desmarais| Despite economic recovery food bank use remains...