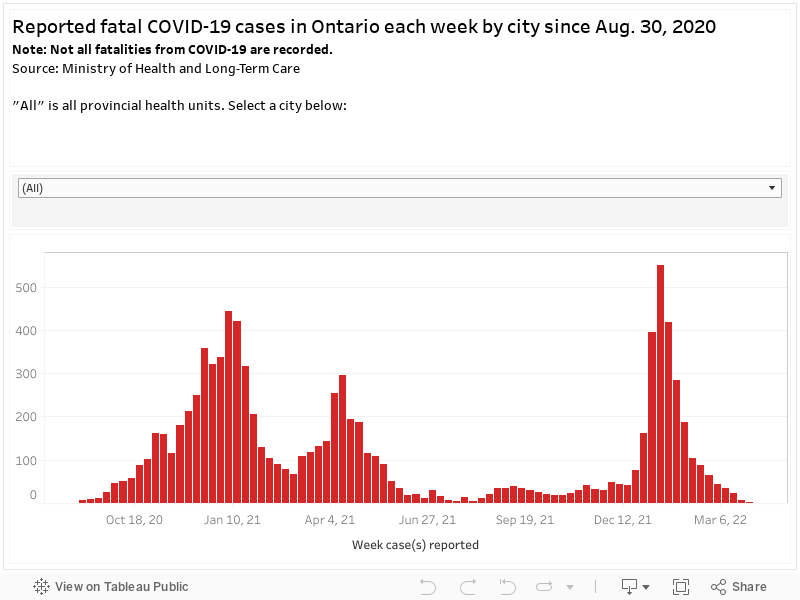
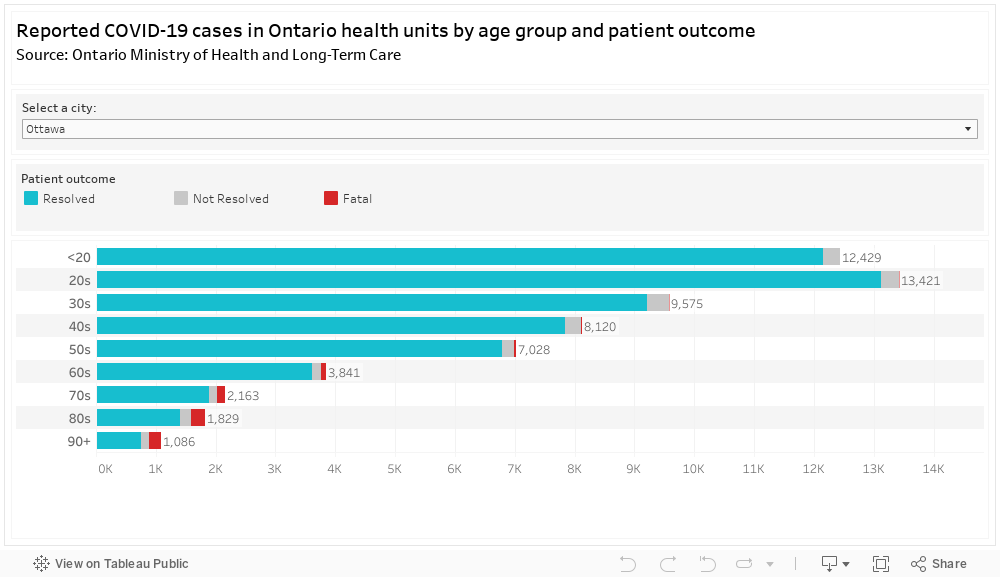
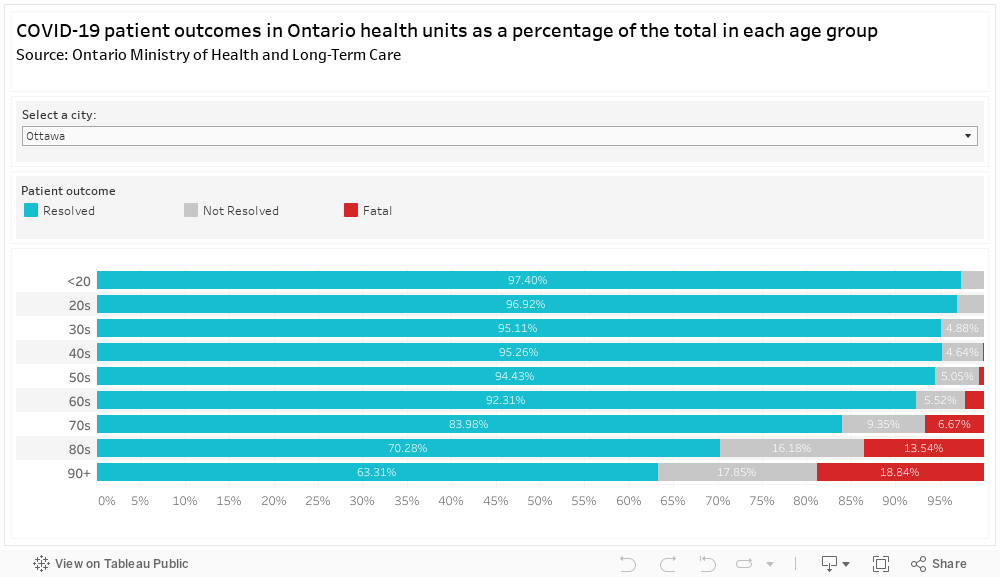
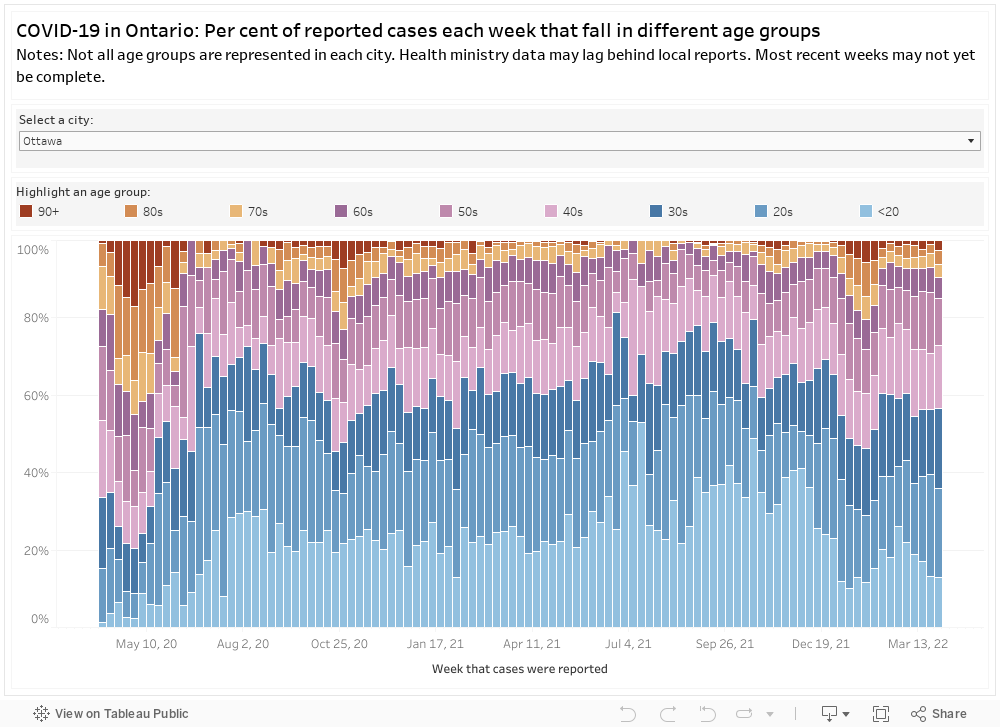
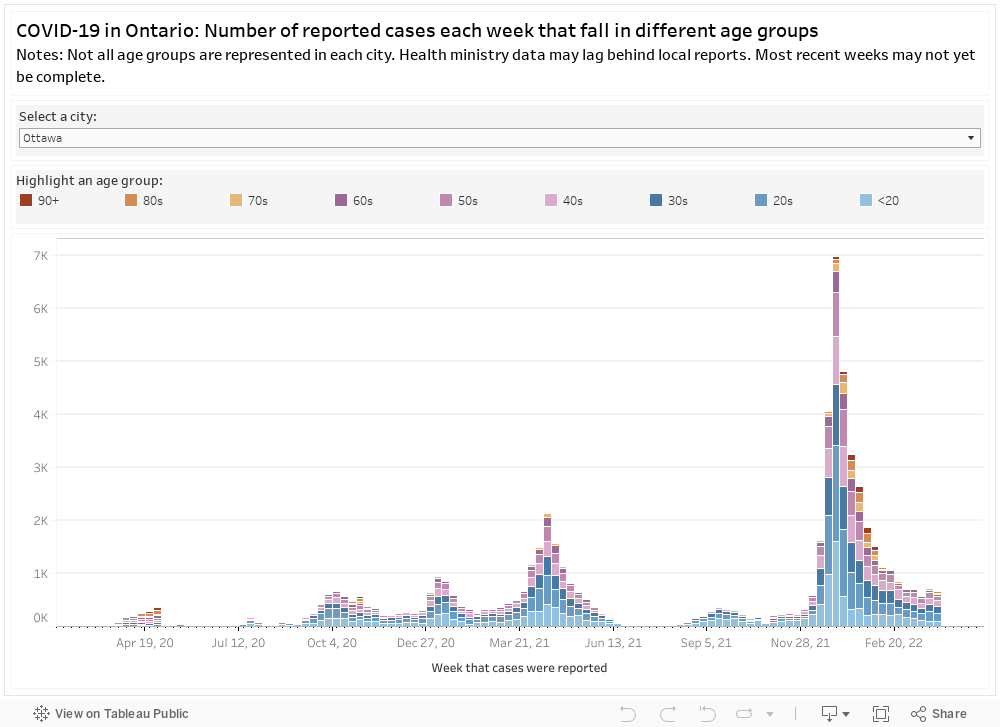
The following two graphics are based upon data from the Ontario Ministry of Health and Long-Term Care. Note that data may be revised. For example, patient outcomes may not be known for some time. Also, keep in mind that data is heavily reliant on the amount of testing. Furthermore, not all cases of COVID-19 are reported. Some people may have only very mild symptoms or even not know that they have (or have had) the disease.
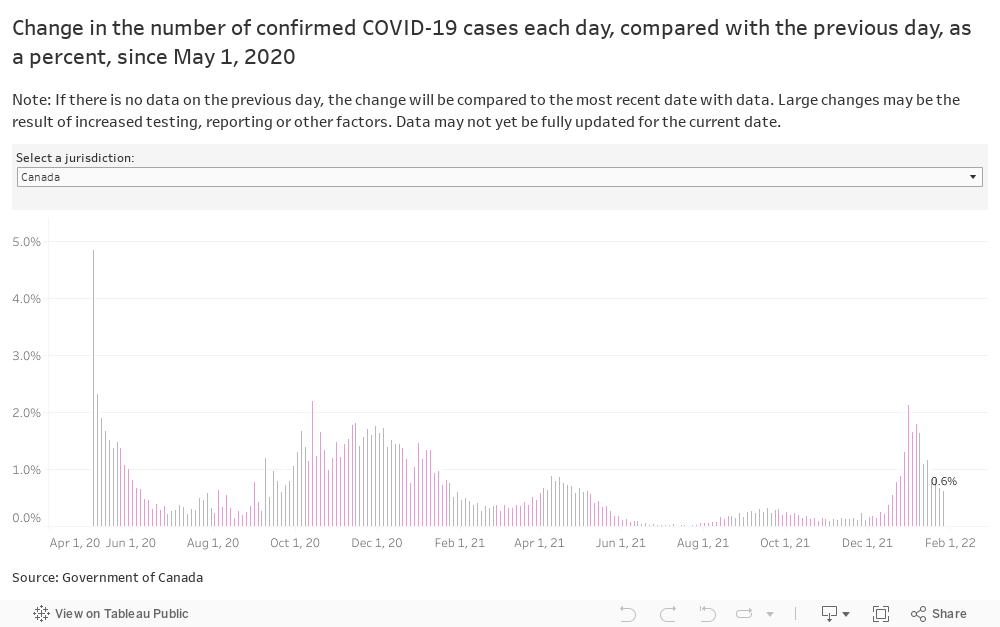
The following are based upon data from the Public Health Agency of Canada. Note that the agency receives data from the provinces and territories, which in turn gets data from local health authorities. This means that the national picture will lag behind local indicators.
The following graphic illustrates the day-by-day changes, as a percentage. In other words, what’s the difference between today’s numbers as compared with yesterday’s, in percentage terms.


[…] Click here for more COVID-19 graphics […]
[…] Click here for more COVID-19 graphics […]