The black market for cannabis persists, drug-impaired driving charges in Ottawa have increased and men are significantly more likely than women to use pot, data from Statistics Canada and the Ottawa police shows.
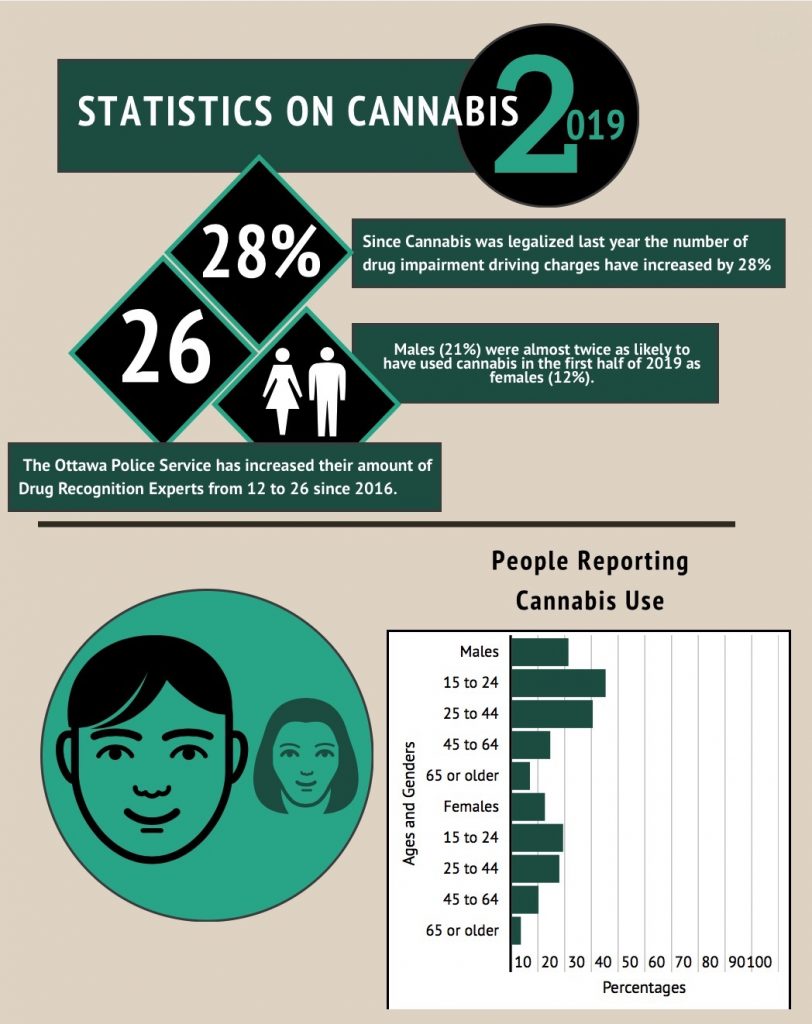
Between 2018 and 2019 the number of drug-impaired driving charges increased 28 per cent, according to the Ottawa Police Service.
Const. Amy Gagnon, a drug-recognition expert (DRE) with the Ottawa Police Service for three years, said that the number of DREs increased to 26 this year, from 12 in 2016. DRE’s are officers who are able to identify the form of impairment in drivers and charge them if necessary.
Gagnon said she doesn’t know whether the increase in charges is because more people are driving high or that there are more educated officers on the roads.
“We’re really out there to make the roads safer,” she said. “At the end of the day the less impaired drivers on the streets the better.”
Marijuana, which was legalized on Oct. 17, 2018, is also significantly more likely to be used by men, according to Statistics Canada.
Statistics Canada’s National Cannabis Survey, released in August, reported men are almost twice as likely as females to use cannabis. The survey found 21 per cent of men used cannabis, compared to 12 per cent of women. The highest usage was among young men aged 15 to 24, followed by men aged 25 to 44.
“Environmental, cultural and developmental factors may explain why we see higher rates of drug use among males than females,” said Michelle Rotermann, a senior analyst for the federal agency.
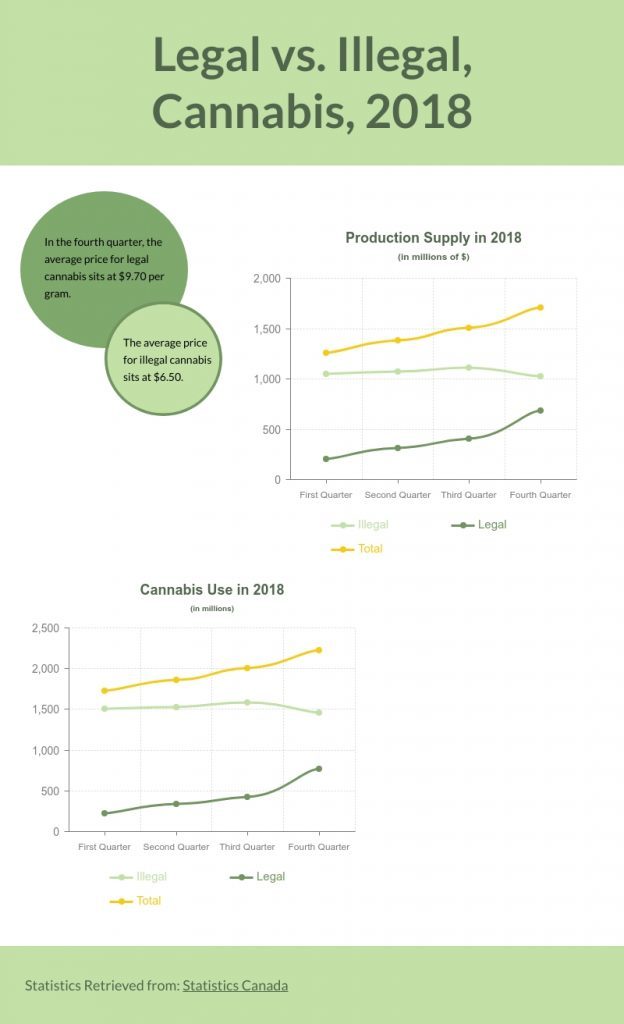
A separate Statistics Canada report from the fourth quarter of 2018 showed pot is still significantly cheaper on the black market. At that time, the average price per gram for legal cannabis was $9.70 per gram, while illegal weed averaged $6.50.
“It seems that the black market still underprices the legal market so that’s why it is still a market,” said a local cannabis dealer, who wishes to remain anonymous because he said it would compromise relationships with his clients.